
- August 27, 2018
The 2017/18 update expands the database and provides the public with more information on tax performance.
On August 24, 2018, USAID went live with the updated version of its Collecting Taxes Database (CTD), which was updated by Nathan under the Leadership in Public Financial Management II Project. This database is a compilation of internationally comparable statistics about taxation designed to provide policymakers, practitioners, and researchers with the means to conduct cross-country analysis on domestic revenue mobilization (DRM). It is part of a wider push by USAID and the international community to help countries strengthen their tax systems and mobilize domestic revenue.
Since 2008, CTD has been a flagship effort to bring tax system assessment and measurement into the mainstream. CTD is unique because it is the only publicly available database to provide tax administration indicators for developing countries and provides alternative measures to tax performance on a global scale. In 2014/15, Nathan helped USAID to refine and improve its indicators, methodology, sources, and data. This process included a review of over 40 indicators from relevant literature, and consultations with tax experts from the IMF, World Bank and government to determine the final indicators used today.
The 2017/2018 update improved on the previous iteration by increasing the indicators measured from 19 to 20 (with the addition of e-registration) and expanding the number of observations due to the increased availability of data.
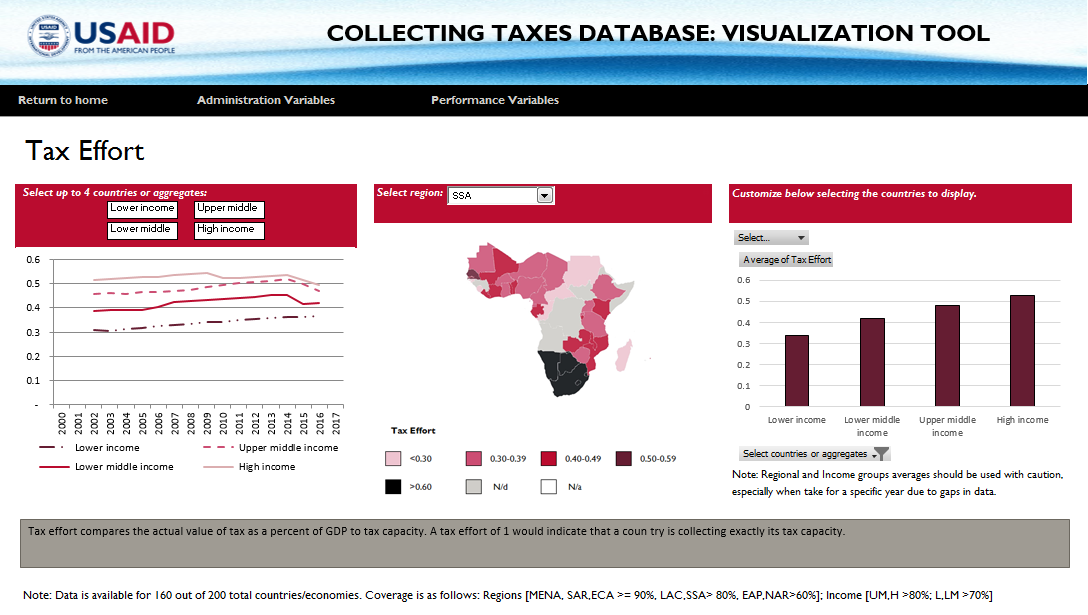
Nathan also designed an interactive data visualization tool for USAID through which users can compare different countries, regions, and income groups by indicators.
The database consists of two sets of data: tax administration and tax performance indicators. The tax administration variables compare administrative frameworks, functions and the roles and powers of the revenue authority. The tax performance indicators show how different types of taxes are effective in mobilizing revenue for a given country.
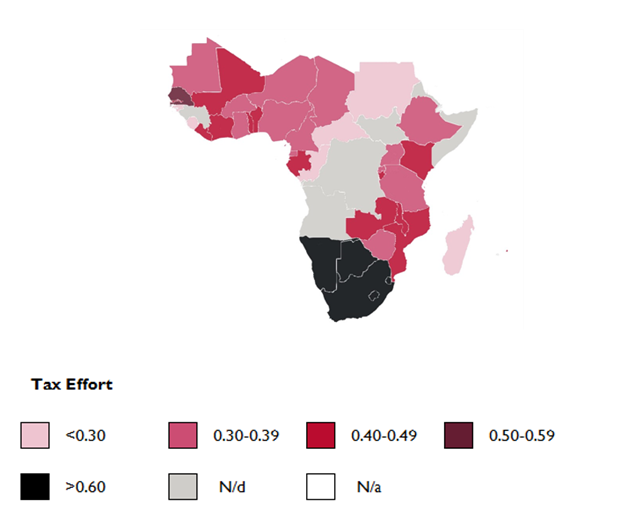
High-level analysis of the database indicates some promising trends and outcomes in tax administration and tax performance. For example, tax effort, which measures the extent to which countries are collecting their theoretic tax potential, has increased over the past fifteen years. When comparing average values from 2001-2005 and 2012-2016, low-income and lower-middle income countries increased their average tax efforts by 5 percentage points each. When looking at tax effort across Sub-Saharan Africa, it is notable that Senegal in West Africa much of Southern Africa have tax efforts exceeding 0.50, significantly outperforming neighboring countries.
For tax administration indicators, 12 more countries reported having large-taxpayer units (LTUs) since the 2014/15 update. These units are important because the risks, requirements, and contributions to the overall revenues by large taxpayers are greater. There were also increases in the number of countries reporting function-based tax administrations, integrated customs and tax administrations, autonomy, e-filing, and e-payment.
USAID will continue to update the resource and provide the public with an informative and accessible dataset that can influence future policy decisions.
For more information, please contact:
Janine Mans
Mid-Level Economist, LPFM II