
- January 18, 2023
By 1932 the Great Depression was in full effect: banks failed, life savings were lost, one of every four workers was unemployed, homeless
encampments were on the rise, and poverty swept over 78% of the population. Despite the grim statistics, the United States Senate ordered
the Department of Commerce to commission a study on the state of the US economy to accurately quantify how much economic activity had collapsed.
Economist Simon Kuznets, then at the National Bureau of Economic Research, was joined by his former student from Wharton Robert Nathan to carry
out the most thorough economic study at the time.
As Nathan himself noted, “we did not have the sophisticated sampling techniques of today or what passes today as the simplest of computers”.
Much of their work was hand calculations, gathered from whatever surveys, data, and knowledge available to them.
Nowadays, national income in many countries is informed by specific surveys asking firms and individuals questions on their income, spending,
and activity. From tax returns and surveys on manufacturers, trade and retail, and construction spendings, to Bureau of Labor Statistics employment
data—the list is now extensive and covers more sectors than ever before. These innovations expanded the meaning of national income and have
increasingly standardized interpretation to include chain linking, imputing rent, measuring financial intermediation, and aligning with other data
measurement standards through the System of National Accounts (SNA). But fundamentally, what is really being measured?
What is National Income?
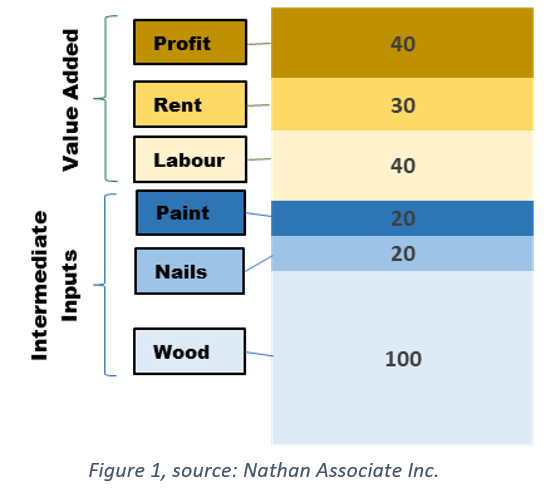
National income does not measure what the economy has, but rather what it adds to a set of inputs. Take for instance a small-size construction
business. The contribution of this business to the national income is the value of sales it generates minus the cost of paint, nails, and wood
(intermediate goods in graph 1). This leaves the cost of labor and capital that economists label as value added. Totaled up over a whole economy,
>this gives us our national income.
It becomes more complex when analyzing real vs nominal. Nominal is the value of everything produced at the price it sells for today, and so can
be distorted by high inflation. Real measures account for price changes and calculates the value of everything produced at a fixed price—usually
at the price in a fixed “base year”.
Economists also care about whose income is included in the calculation. Two key measures, gross national income (#GNI) and gross domestic product
(#GDP) respectively look at what is earned and remitted home by residents and businesses of a country, even if it is earned abroad; and everything
earned physically in a country, even if earned by foreign businesses or residents. In economic terms, GNI is GDP plus the income flowing in from foreign
countries minus the income flowing out to foreign countries.
Challenges kept arising around how to best measure complex activity such as financial services or property ownership, and the rapidly changing
innovations brought on by technology. Improvements to GDP have helped address these slowly, including the calculation of FISIM (financial
intermediation services indirectly measured) where economists work out a value for financial services that are not directly paid for, using differences
between lending and borrowing rates. Or imputed rent, the hypothetical amount of rent that a homeowner would pay if they were renting their
home instead of owning it.
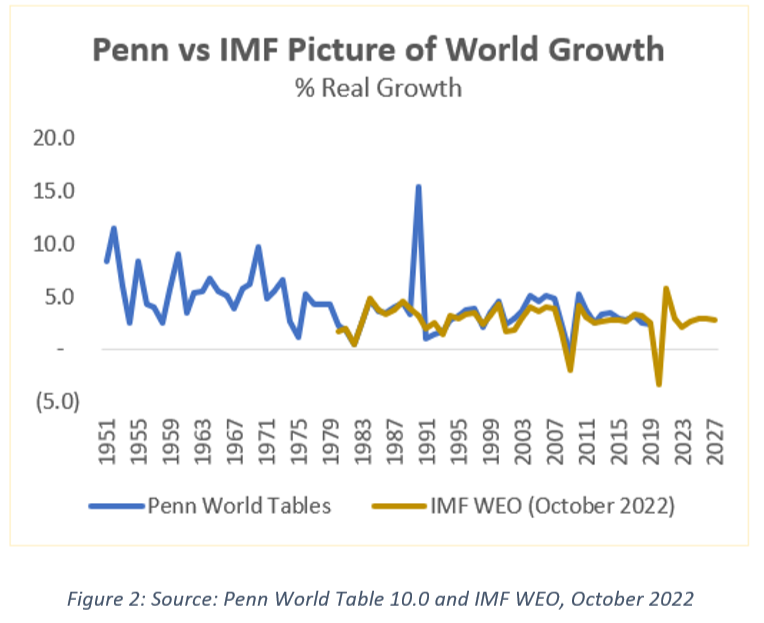
GDP was adopted as the global standard at the 1944 Bretton Woods conference, and today, GDP data exists for almost every country.
This allowed for the building of a comparable picture of the world growth.
How Has it Changed?
The 1950s saw the creation of input-output tables, a giant grid of transactions between different parts of the economy with columns detailing
the value of everything a sector needs as an input, and rows detailing the value of everything produced as an output. This followed on from
the work of the economist Wassily Leontief, using the 23-tonne Harvard Mark II computer and data from the Bureau of Labour Statistics, to
break down the economy into 500 of these interconnected sectors.
Economists have become better at measuring the economy indirectly as well. Informal sector workers prefer not to answer official surveys,
and estimating the informal sector is difficult as a result. To circumvent this obstacle, economists look at the use of cash data as a way to
estimate the size of the informal sector. Since informal economies favor cash-based transactions, and depending on whether the cash-in-circulation
to GDP ratio is higher than in other countries, the assumption is that the informal sector is bigger. While this is a simplification, the underlying idea
is the same in practice.
With new forms of data and larger datasets, we are seeing new innovations such as the concept of “nowcasting”: using high frequency data to
get a quicker idea of what is happening with GDP without the long measurement lag.
It has also included new ways of measuring. For example, using satellite data on light emissions to estimate the GDP of countries where
surveys are harder, since concentrations of light usually mean concentrations of economic activity. This was first outlined in detail in a 2012 paper
by economists Henderson, Storeygard and Weil, but has a genesis earlier than this. In 1978, scientist for the US Geological Survey Thomas Croft
writing for Scientific American spotted a phenomenon as varied as emissions from gas flares on oil fields to a
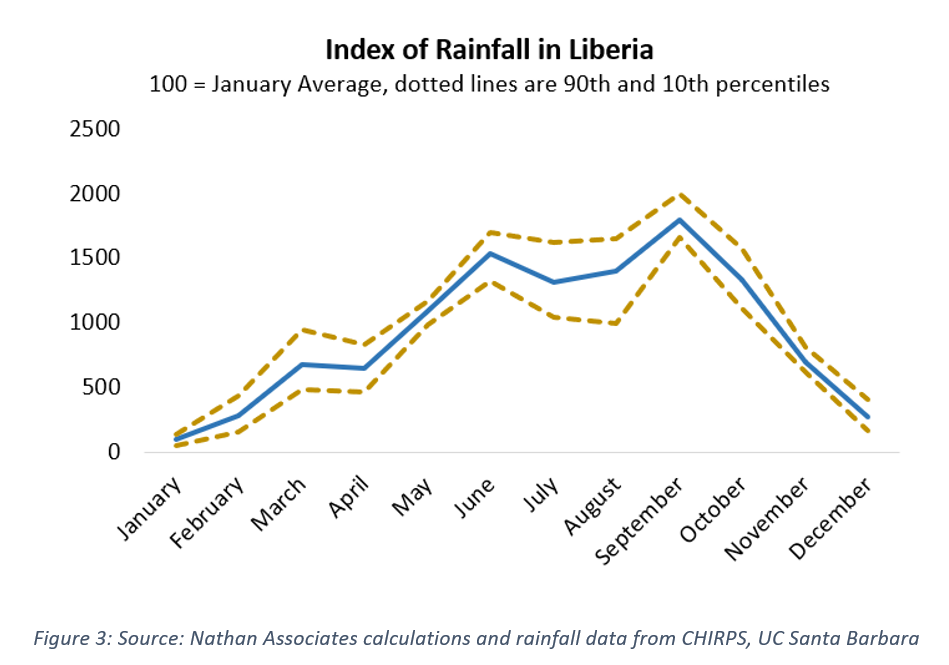
“fairly uniform band of small lights sprinkled across Africa south of the Sahara” marking small fires used to clear agricultural land. Nathan has
used similar techniques to map centers of economic activity in a country, track changes over time, and even use satellites to estimate rainfall
patterns and give early indications of a drought and falls in agriculture activity.
GDP cannot and should not measure all parts of the economy. It may also not be the standard for the long-term measurement of welfare—
a role Kuznets had never intended it have. Concepts like a gross national happiness gained more traction when Bhutan announced it would
be built into its Constitution, but in practice, the direct measurement of happiness is challenging and subject to quirks of human responses
to immediate circumstances, and composite indicators have typically ended up heavily weighting GDP nonetheless. But the gap remains for
measures beyond GDP to touch on issues like poverty, inequality, and lack of opportunity.
The economy is a giant, complex mechanism which policy makers have gained some understanding of through work on GDP, or input-output
tables. Ultimately, we have come a long way since national income was a measurement of the wealth of the King*, and GDP for all its flaws
has become the “beacon that help[s] … steer the economy, as well as measure it” (Samuelson and Nordhaus, Economics, 1948).
* Even pre-Kuznets there were efforts to measure national assets, scientist William Petty in England did some calculations in 1665 to try to prove the nation, and particularly the King, was wealthy enough to take on France and Holland in a war.


PRESS RELEASE: Nathan President & CEO Appointed to Professional Services Council Executive Committee Leadership.

Nathan Releases its 2022 Communication on Progress on the
United Nations Global Compact
The United Nations Global Compact requires participating countries to produce an annual COP detailing their work to
embed the Ten Principles into their strategies and operations, as well as efforts to support societal priorities. Read Nathan’s 2022 COP.
REPLAY: Video Summaries from USAID’S Better Access
and Connectivity (BEACON) Activity
REPLAY: The Malawi Innovation Challenge Fund Impact Video
This Malawi Innovation Challenge Fund (MICF) video reflects on the experience in catalyzing inclusive growth in #Malawi,
providing an overview of the challenge fund instrument and showcasing the impact of the business models developed
throughout the eight years of programme implementation. Watch the video below.
Highlights from Invest Salone
Strengthening SMEs for Productivity and Competitiveness

After initial assessments conducted earlier this summer, SMEs that will receive support under Invest Salone’s technical assistance facility gathered in Freetown on 8 December 2022 for an orientation session to learn more about the process and its benefits. Read more
Finance for Sustainability in Sierra Leone

Invest Salone and the Bank of #SierraLeone met discussed the next steps in the sustainable finance roadmap, intended to help integrate sustainability into Sierra Leone’s financial system, guide its response to major environmental, social and governance challenges. Read more.
Latest Publications from Invest Salone (click image to download)


- Analyst, Financial Services bit.ly/3WElmnt
- Private Sector Liaison Specialist bit.ly/3WtFZTm
- #PolicyResearch Specialist bit.ly/3v9VoMF
- Senior International #Recruiter bit.ly/3HQHOFs
- #ConsumerProtection (Financial Products) Expert bit.ly/3uNxK8L
- Information and Communications Technology Specialist bit.ly/3Pt656F #ICT
- Gender, Equality, Disability and Social Inclusion Trade Manager bit.ly/3W5Uix6 #GESI
- Deputy Chief of Party bit.ly/3BKLlBJ
- Call for Technical Experts bit.ly/3HrMYrp
- #ClimateFinance Advisor bit.ly/3VKsr5P
- Chief of Party, Climate Finance in Asia-Pacific Region bit.ly/3Bn25i2
- #Technology Advisor bit.ly/3FEnC8k
- Managing Associate, Gender and Social Inclusion bit.ly/3PfOleT
- Principal Associate bit.ly/3hgr7bR
- Research Associate Economic Engagement & Private Sector Development bit.ly/3FCt8Zi #PSD
- Associate, Economic Engagement & Private Sector Development bit.ly/3FeFzsM
- SWIFT 6 IDIQ Manager bit.ly/3BnP2Nd
- Director, #USAID Digital Strategy Implementation & Program Activity bit.ly/3Wi4B1y
- Project Accountant bit.ly/3FGqWQC

Website | Twitter | Facebook | LinkedIn | YouTube | Flickr
Contact us: /">